

SatOM · Operations and maintenance
SatOM reads satellite imagery over every site you operate and flags the things that cost money: asset condition, vegetation encroachment, thermal anomalies and improper drainage. You draw the boundary. We do the watching.
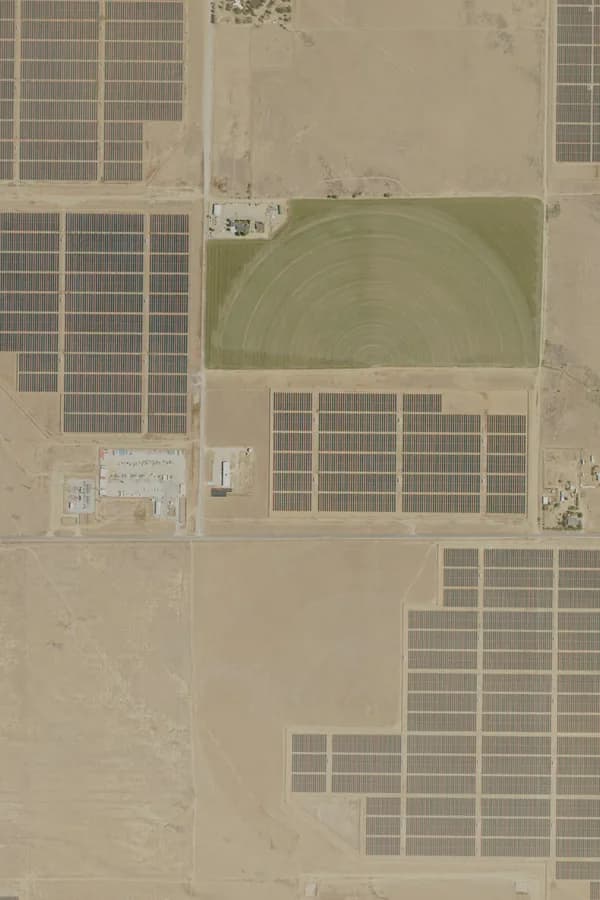 Solar park
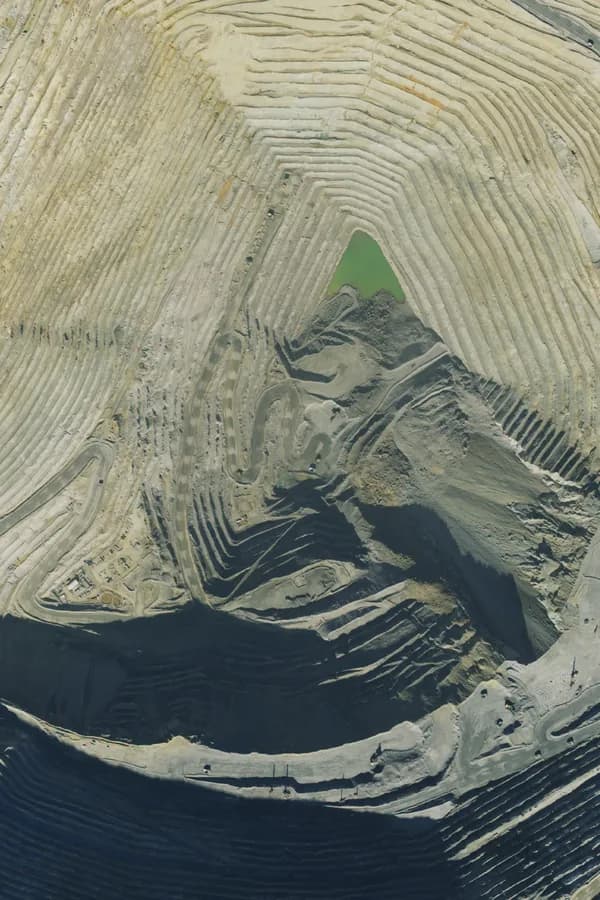 Open-pit mine
A solar park in California and an open-pit copper mine in Utah, USA. Imagery: USDA NAIP.
Mostly people who answer for sites they cannot visit every week.
Asset owners and IPPs
A ranked list of which sites and which assets need attention first, so the maintenance budget goes where the loss is.
O&M contractors
A work list for the crew, and a phone page where they confirm or correct what the satellite saw.
Mine and industrial operators
Vegetation encroachment, thermal anomalies and drainage problems across a large lease without walking it. Radar keeps working through cloud and at night.
Lenders and insurers
A dated record of how an asset has been kept, going back to the day monitoring started.
Asset condition and storm damage are graded unit by unit and need the site's CAD layout. The rest work on any boundary you draw.
Asset condition
Every asset is graded for condition against the site's own layout. You see which units need attention first, not just that the site is ageing.
Vegetation encroachment
Growth closing in on structures, equipment and access roads, mapped as zones and graded by how serious it is.
Thermal anomalies
Land surface temperature across the site, read against that site's own normal, so unusual heat stands out. It reads zones, not single units.
Improper drainage
Pooling after rain and weak drainage, so you know where access roads and foundations are at risk.
Storm damage
Compares radar from before and after a storm and lists the blocks that changed, for a crew to go and check.
Field check
A crew opens a phone page, sees the grade for an asset or zone, and marks it right, wrong or actioned. That history stays with the site.
Draw the site
Draw a boundary on the map, or upload the site's CAD layout if you want asset-level results.
We process every pass
Optical images arrive about every five days. Radar fills the gaps when it is cloudy.
You act on it
Graded maps by date, a ranked work list, a PDF action plan, and the crew phone view.